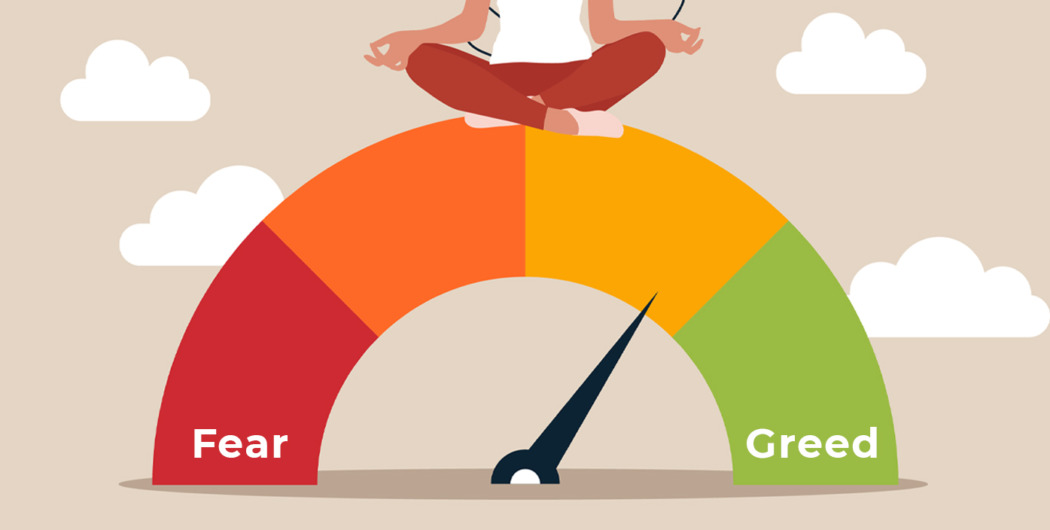

Market sentiment reflects the overall attitude toward a certain market. It takes into account both fundamental factors and technical indicators. There are two key sentiments the market experiences — fear and greed. Fear makes the market participants sell the asset, pulling its price down. Greed pushes the asset’s price up, as investors keep on buying it.
The indicator was developed by CNNMoney to assess how emotions shape investors’ behavior. Since then it’s become widely used across various industries. For example, crypto experts claim that as of mid-July, the crypto market broke the fear record, which explains why digital asset holders massively sell crypto.
Let’s examine whether it really works.
Earn profit in 1 minute
How the Fear and Greed Index Works
For the most part, you can create your specific Fear and Greed Index. The only condition is for the data to be used correctly. For the market events to be assessed realistically, you are required to have a certain knowledge of them. This allows you to get past certain “roadblocks.”
The fear and greed index is based on the idea that great fear can result in stocks traded way below their true value. On the other hand, greed can lead to stocks being bid at higher prices than what they are worth. The index gauges the sentiments of the investor so that they may take the right decision.
Effective strategies in your mailbox
Subscribe and discover a fund of trading knowledge
Great! Please check your email
We’ve sent you an email to confirm your subscription
Something went wrong
Try reloading the page. If that doesn’t help, please try again later
Benefits of Using a Fear and Greed Index

There are several benefits to using the Fear and Greed index. Some of the most important ones include:
1. Simplicity
This indicator is fairly straightforward to use, even by a beginner trader. Most day traders will separate its readings into quadrants. This allows them to create special strategies for each part of the index. For experienced traders that wish to customize their earnings, this can be very beneficial.
2. Confirms Reversal Signals
The fear and greed index is capable of confirming reversal signals, as long as you use it together with other technical analysis forms. It can also give you the signal for when to reap profits from an already successful trade. This will prevent any potential losses.
3. Very Common
The fear and greed index is followed by a variety of traders. Due to this, it has that “self-fulfilling prophecy vibe” that traders can follow. As it is so common, gathering data for the index is very easy to do.
Criticisms of the Fear and Greed Index
While the fear and greed index is quite popular, skeptics argue that it encourages and supports overactive trading. These traders prefer the long-term buy-and-hold technique to gain wins in the long run.
Trading with up to 90% profit
However, the criticism is subjective. In a way, it divides day traders from long-term investors. The former want short-term gains through multiple trades, whereas the latter group is following a long-term predictable outcome.
5 of the best scalping indicators to use right away
You can experiment with various indicators, but there are some you can use right away to build your best scalping strategy.
Read more
What is behind the fear and greed index?
You probably already know that some technical indicators determine when an asset is overbought or oversold and are used to predict when the price will reverse. The most popular examples are the Stochastic Oscillator and Relative Strength Index. The fear and greed index was developed with the same goal — to define whether the market is fairly priced. But there is an essential difference — the index shows the sentiment of the whole market, while indicators are calculated for each asset separately.

How to calculate the fear and greed index
The index is calculated automatically and presented on the CNN website. There you will find data on the current market sentiment and what the sentiment was a week, a month, and a year ago. The index is updated every time new data appears regarding any of its seven components.
The index is based on seven stock market indicators that have equal weight in its total score. It considers how much the indicators deviate from their means compared to their normal divergence.
The indicators are:
- Market momentum. It considers the value of the S&P 500 Index compared to its 125-day moving average.
- Stock price strength. It compares the number of stocks that have hit their 52-week highs versus the number of stocks that have hit their 52-week lows on the NYSE (the New York Stock Exchange).
- Stock price breadth. It analyzes the degree of trading volume in the stocks that rise in value versus the degree of trading volume in the stocks that fall in value.
- Put and call options. The indicator considers the degree to which put options underperform call options, reflecting greed, or put options overperform call options, determining fear.
- Junk bond demand. It determines whether the market prefers higher-risk strategies using the spread between yields on junk and investment-grade bonds.
- Market volatility. It is measured via the Cboe’s Volatility Index (VIX) based on a 50-day moving average.
- Safe haven demand. It is determined as a difference in returns on stocks versus treasuries.
Each of the seven indicators has a score from 0 to 100.
How to apply the index
Although the index varies from 0 to 100, it’s enough to know only one figure — 50.
- When the index equals 50, the market sentiment is neutral.
- Everything below 50 signals fear and a fall in stocks’ values
- Everything above 50 shows investors are actively buying stocks and driving their prices up.
0 stands for absolute fear, and 100 reflects absolute market greed. These are the points that signal an upcoming market reversal. Therefore, investors can use market fear as a buy signal and market greed as a sell signal.
Why you should use the fear and greed index
You will like this tool if you like the momentum indicators, such as the RSI and Stochastic. The index is a great barometer of whether the stock market is at its intrinsic value. Any imbalance will lead to market reversals. Although some skeptics believe the index is harmful, as it makes investors frequently trade in and out of stocks instead of using the buy-and-hold strategy, there is evidence of the index’s usefulness.
For instance, its score plunged to 12 in September 2008. This was a signal of significant market fear as the S&P 500 touched three-year lows. In September 2012, the index’s score was above 90, while global equities skyrocketed due to the third round of the Fed’s quantitative easing.
Takeaway
Although the fear and greed index is used only for the stock market and can’t be solely used to determine market reversals, it’s an interesting tool an investor should have when entering the equity market. While figures around 50 won’t provide clues on the upcoming price direction, the index’s extreme values can be used as points where the market will reverse.
Start from $10, earn to $1000
<span>Like</span>