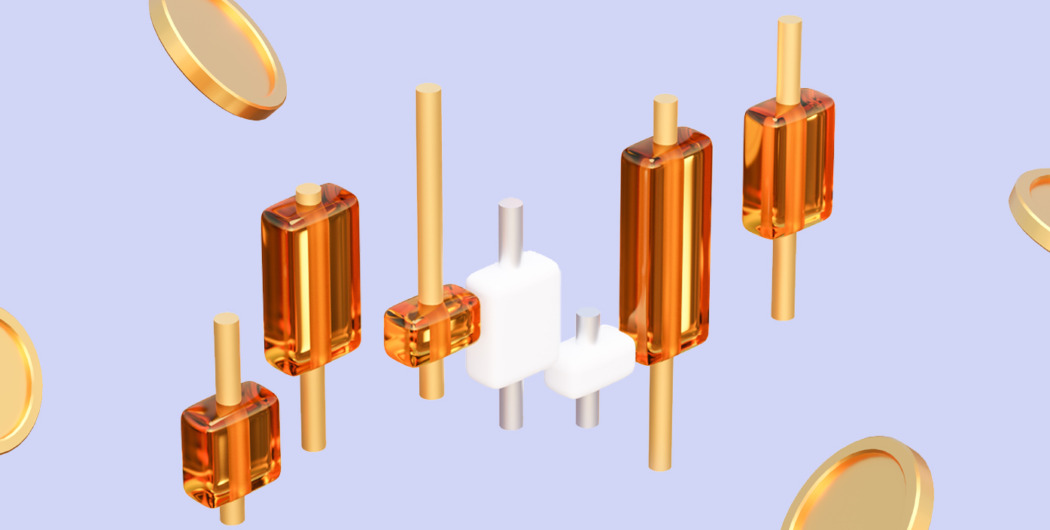
There are many candlestick signals in trading. Candlesticks may provide alerts on the future price direction alone or form patterns.
When reading candlestick signals, pay attention to the candle’s color. There are four common colors. These are white and green for a bullish candle and black and red for a bearish one. Although you can customize the color yourself, it’s not recommended as you may be confused.
Keep reading to discover the most effective candlestick patterns.
Start from $10, earn to $1000
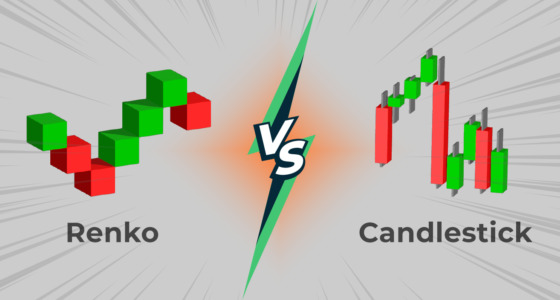
Candlestick vs. indicators
You shouldn’t compare these trading tools. Indicators are mathematical calculations that are mostly based on candlesticks. A candlestick is a chart type used in technical analysis. These are different approaches to price predictions. Both candles and indicators provide signals on the reversal and continuation of a trend. Therefore, you can combine them to confirm the signal.
Effective strategies in your mailbox
Subscribe and discover a fund of trading knowledge
Great! Please check your email
We’ve sent you an email to confirm your subscription
Something went wrong
Try reloading the page. If that doesn’t help, please try again later
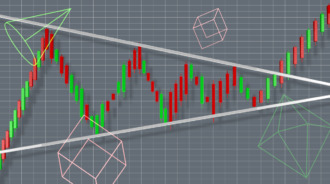
Types of signals
There are two types of candlestick signals – reversal and continuations.
- What is a candlestick reversal signal? It’s a market condition in which a candlestick or a set of candles warns traders of the change in the current trend.
- What is a candlestick continuation signal? It’s a situation in which a candle or a set of candles provides an alert that the current trend will continue.
Candlestick reversal signals
Candlestick patterns are mostly used to determine a trend reversal.
Trading with up to 90% profit
1. Hammer and inverted hammer

Hammer and inverted hammer are one-candle patterns forming at the end of a bearish trend. The candle’s body should be at least twice less than the shadow (lower shadow for a hammer and upper shadow for an inverted hammer). If the hammer candle is bullish, the signal is more solid. If the hammer-following candle closes above the opening point of the candle before the hammer, it’s another confirmation of the trend reversal.

Hammer

Inverted hammer
2. Shooting star
A shooting star looks similar to an inverted hammer. The difference is that it occurs at the end of a bullish trend.

3. Piercing line
This pattern consists of two long candles. The first one is bearish, and the second one is bullish. The second candle should open below the closing price of the bearish one and close above the half of the body of the bearish candle.

4. Morning star and morning Doji star
These patterns include three candles. A long bearish candlestick is followed by a small one (the color doesn’t matter), opening with a gap down. The small candle is followed by a long bullish candlestick that fills the previous bearish gap. Usually, it’s even longer than the first bearish candle.

A gap isn’t a must, but it strengthens the signal.
Morning Doji star has similar implications, but the second candle is Doji. This pattern is stronger than the morning star pattern.

5. Engulfing pattern
It consists of two opposite candles. In a bearish pattern, the bearish candle opens above the high and closes below the low of the bullish one.

A bullish engulfing pattern signals the end of a bearish trend. The bullish candle contains the bearish one.

Engulfing signals are solid as the second candlestick fully engulfs the first one. The larger the size difference between the two candles, the stronger the signal is.
6. Harami and harami cross
These are two-candle patterns. Bearish harami consists of a bullish candle that fully contains a body of a bearish candle. The pattern should be confirmed by the next long bearish candlestick.

A bearish harami cross looks similar, but the second candlestick is Doji.

Bullish harami and bullish harami cross patterns look similar but occur at the end of a bearish trend. A bearish candle should fully contain a bullish one.

Bullish harami

Bullish harami cross
If there is a gap between harami and the following candle, the signal of the price reversal will be stronger.

Continuation candlestick signals
Continuation candlestick patterns usually appear before the price breaks out. The candlestick breakout signals can be caught from the following candles:
1. Separating lines
The pattern occurs in an uptrend. It includes a long bearish candlestick followed by a long bullish candle that opens at the level where the bearish candle opened (there can be a gap on smaller timeframes). The bullish candle shouldn’t have a lower shadow.

2. Three-line strike
The pattern includes four candles. A bullish pattern has three bullish candlesticks that close one above another and a long bearish (strike) candlestick that opens and closes beyond three candles. Three candles should have an average size. The fourth candle reflects a temporary correction.

A bearish three-line strike pattern predicts a bearish reversal and consists of three bearish candles followed by a long bullish one.
3. Three method
In a bearish pattern, a long bearish candlestick is followed by two to five small bullish candles. They shouldn’t rise above the opening price of the bearish candlestick. The last candle of the pattern should open within the body of the previous bullish candle and close below the first bearish candle.

A rising three-method pattern occurs within an uptrend. It starts with a long bullish candle followed by three small candles moving in the opposite direction.

4. Tasuki gap
The pattern forms when there is a gap down between two bearish candles. The third candle should open above the closing price and close above the opening price of the previous one. However, the gap shouldn’t be filled. If the bullish candle couldn’t fill the gap, you can open a sell position or increase the existing one.

In a bullish trend, the gap will be between two bullish candles, and the third candlestick will be bearish. It shouldn’t fill the gap.

Takeaway
Although candlesticks provide reliable signals, you should always confirm them with technical indicators. Also, it’s recommended to practice candlestick trading on a demo account, looking for patterns on various timeframes and for different assets.
Earn profit in 1 minute
+5 <span>Like</span>