
A bull trap is a common trading concept. Bull traps are considered dangerous as they may lead to losses. Still, it’s possible to trade them with potential returns. What’s a bull trap in trading, then? Let’s dive in and learn more about it.
Bull trap explained
A bull trap concept is called this because it’s associated with buying trades. Buyers are called bulls, while sellers are called bears. The terms came from London’s Exchange Alley, where traders who participated in a bear’s skin selling were called “bear-skin jobbers” or “bears,” while traders who bought the skin were called “bulls.”
Traders try to enter the market early when there is a trend. Breakout trading is one of the opportunities to do this. The rule is that when the price goes beyond a strong resistance or support level, it’s more likely a new trend will be formed.
However, it’s not always the case — some breakouts turn into fakeouts or false breakouts. A fakeout is a market condition when a price goes beyond a strong support or resistance level but returns to the previous trend. Fakeouts are the basis of bull trap trading.
A bull trap is when a price breaks above a resistance level and rises for a while. Then it turns around, resulting in a losing trade. It happens due to various signals, but if you know how to identify a bull trap, you won’t fall into the trap.
Note: There is also a bear trap. It’s a situation when a price breaks below a strong support level but turns around and continues rising.
Bull trap: example

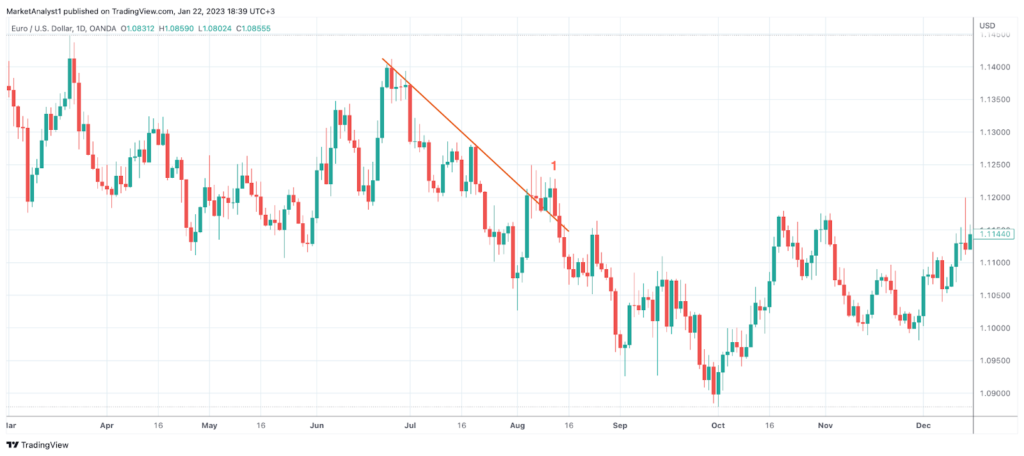
The chart above shows a bull trap that occurred on the daily chart of the EUR/USD pair. The price rose above the resistance level (1) but fell and continued trading in a downtrend.
Bull trap trading
Although a bull trap can’t be used as an opportunity to enter the market at a formation of a new uptrend, you can use it to enter the market in a downtrend. The first thing you need to do is identify whether it’s a fakeout.
How to identify a fakeout
No indicator will signal a fakeout with 100% accuracy. Still, there are signs you can use to doubt a breakout.
- Strong downtrend. If the price moves in a solid downtrend, the probability of a breakout is lower.
- Low trading volumes. Significant volumes accompany a breakout. If the volumes are low, the chances of a breakout are lower.
- Weak resistance level. The more often a price touches a resistance level, the stronger a breakout is.
- Lack of reversal signals. If the price breaks above the resistance level in a downtrend or a consolidation period but reversal indicators such as the RSI, the MACD, the Stochastic, and the moving average don’t forecast a trend change, it may be a fakeout.
- Lack of reasons. If the price rises above a resistance level, but there are no fundamental reasons for a trend reversal, it’s more likely a breakout will turn into a fakeout.
Note: a bull trap may occur in a downtrend, a sideways trend, or an uptrend. However, the probability of it being in an uptrend is the lowest.
Bull trap trading strategy
These are common rules to trade a fakeout.
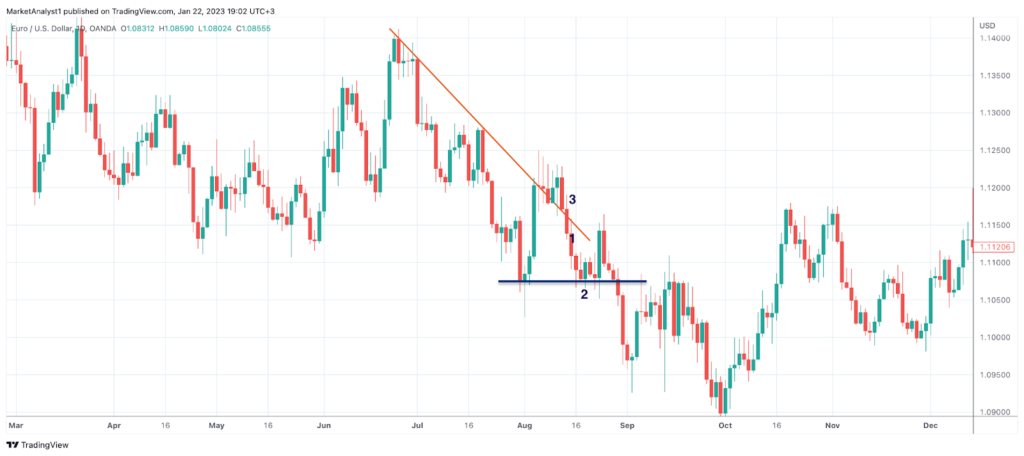
- Entry. You may open a sell position once the price falls below the resistance level after a fakeout and the candlestick closes (1).
- Take profit. A take-profit target can be set at the closest support level (2).
- Stop loss. A stop-loss order can be placed according to the 1:2 or 1:3 risk/reward ratio (3).


Final thoughts
A bull trap is dangerous if you don’t know how to use it in your favor. You’ll need to confirm every signal with 2-3 indicators or patterns and enter a trade if you are sure you are right. Still, even if you fall into a trap, use stop-loss orders to limit your potential losses.
Sources:
Bull Trap, Investopedia
What Is a Bull Trap? The Balance


