
Price action is the basis for technical analysis. Technical traders build indicators based on historical price movements; candlestick and chart patterns occur only because price moves in a certain way. Traders simply can’t trade without analyzing price fluctuations.
According to data, there are 42 candlestick patterns that determine price direction based on traders’ sentiment.
Let’s discover how price action reflected in candlesticks can help you identify successful trades.
Start from $10, earn to $1000
Price action: definition
Price action represents an asset’s price movements over time. The price forms trends. These are up (bullish), down (bearish), and sideways. They change around.
Price movements can be reflected in various chart types. The most popular ones are the Japanese candlesticks, Heikin Ashi, and Linear.
In this article, you will find tips on how to find successful trades using Japanese candlesticks because this chart type reflects price action the best.
Effective strategies in your mailbox
Subscribe and discover a fund of trading knowledge
Great! Please check your email
We’ve sent you an email to confirm your subscription
Something went wrong
Try reloading the page. If that doesn’t help, please try again later
Price action: trading
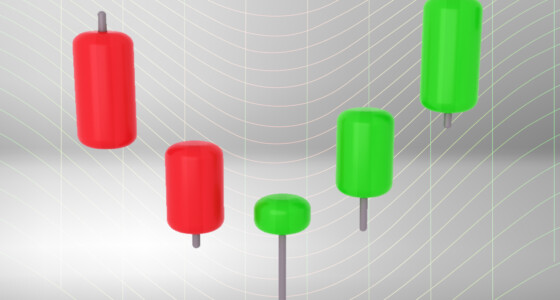
Japanese candles are the most straightforward way to reflect price movements. Every candlestick has a body built based on open and close prices for a certain period determined by a timeframe and may have shadows. Shadows reflect the highest and the lowest values for a certain period.


Candlesticks have different colors. Usually, white or green stands for a bullish candle, while black or red is used to reflect a bearish candle. If you use a daily timeframe, one candle will reflect an asset’s open, close, highest, and lowest values for one day. If you trade on a 5-minute chart, every candle will reflect an asset’s prices for 5 minutes.
As you can see, candlesticks have all the necessary information you need to evaluate price fluctuations. Candlesticks have different shapes — some don’t have shadows, some have small bodies, etc. All these tell you about market sentiment and potential price direction. Let’s consider how you can use it in your favor.
Candlestick shapes
Looking at candlesticks, you can evaluate market sentiment as every candle reflects how strong buyers and sellers were. The most common rules are:
- When shadows are too long, price volatility is large, and traders are unsure about the future price direction.
- When there is a long upper shadow in a bullish or bearish candle, it means bulls were too weak to push the price. Therefore, it may turn down soon.
- A long lower shadow in a bullish or bearish candle means bears were weak, and the price may rise soon.
- A thin body of a candle says neither bulls nor bears could take control over the market.
7 golden rules of trading
Everyone has their own trading style, but some principles are critical for success. Make sure you’re following these basic rules of trading.
Read more

Price action patterns
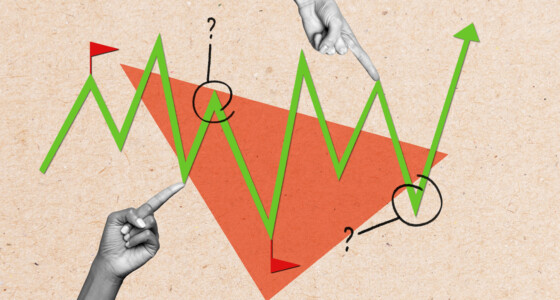
However, those rules are only standard interpretations, and sometimes they don’t work. It’s better to use patterns that have proved their effectiveness. Candlestick patterns consist of one to five candlesticks and chart patterns that form certain figures that remind well-known things. For instance, a head and shoulders, a cup with a handle, a triangle, etc. Both candlestick and chart patterns signal either trend continuation or its reversal.
Trading with up to 90% profit
There are numerous patterns you can find on a chart of any asset. There is no opportunity to list and explain all of them in one article, but you can catch the idea of how to use them.
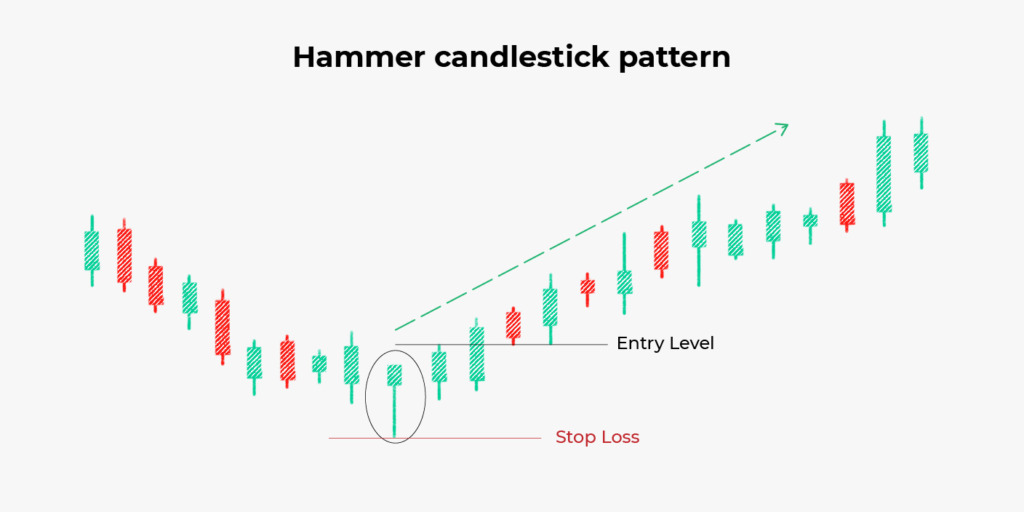
Hammer
A hammer is a candlestick pattern that consists of one candlestick. It has a small body that is at least two times smaller than the lower shadow. It appears at the end of the bearish trend. As the lower shadow is long and the body is small, it’s a sign bears didn’t have the strength to pull the price further. You could draw a resistance line above the hammer candlestick and enter the market if the price broke above it. A stop-loss order could be slightly below the lowest value of the hammer.
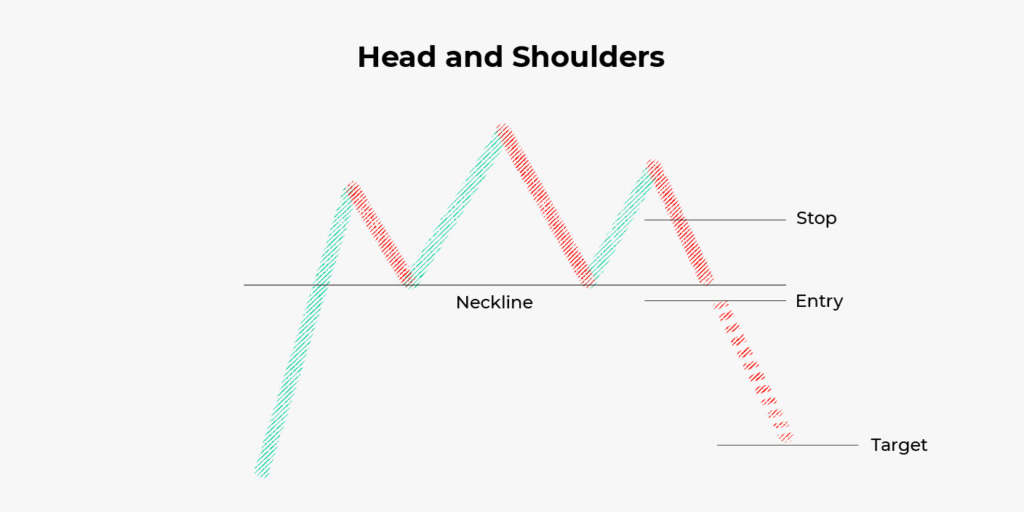
Head and shoulders

Head and shoulders is a chart pattern that reflects a trend reversal. It includes three tops, where the second one is the highest. Draw a neckline through troughs between the head and its shoulders. It will serve as support. If the price falls below it after the second shoulder’s formation, open a sell trade some points below the neckline. Your target will equal the distance between the head and the neckline. A stop-loss order can be placed slightly above the neckline. The distance always depends on the price volatility.
Takeaway
Price action is the first thing you should consider when deciding whether to buy or sell an asset. However, price movements can’t be evaluated solely. You should use technical indicators and look for standard patterns to catch signals.
Earn profit in 1 minute
<span>Like</span>